Data Vis for CityLab
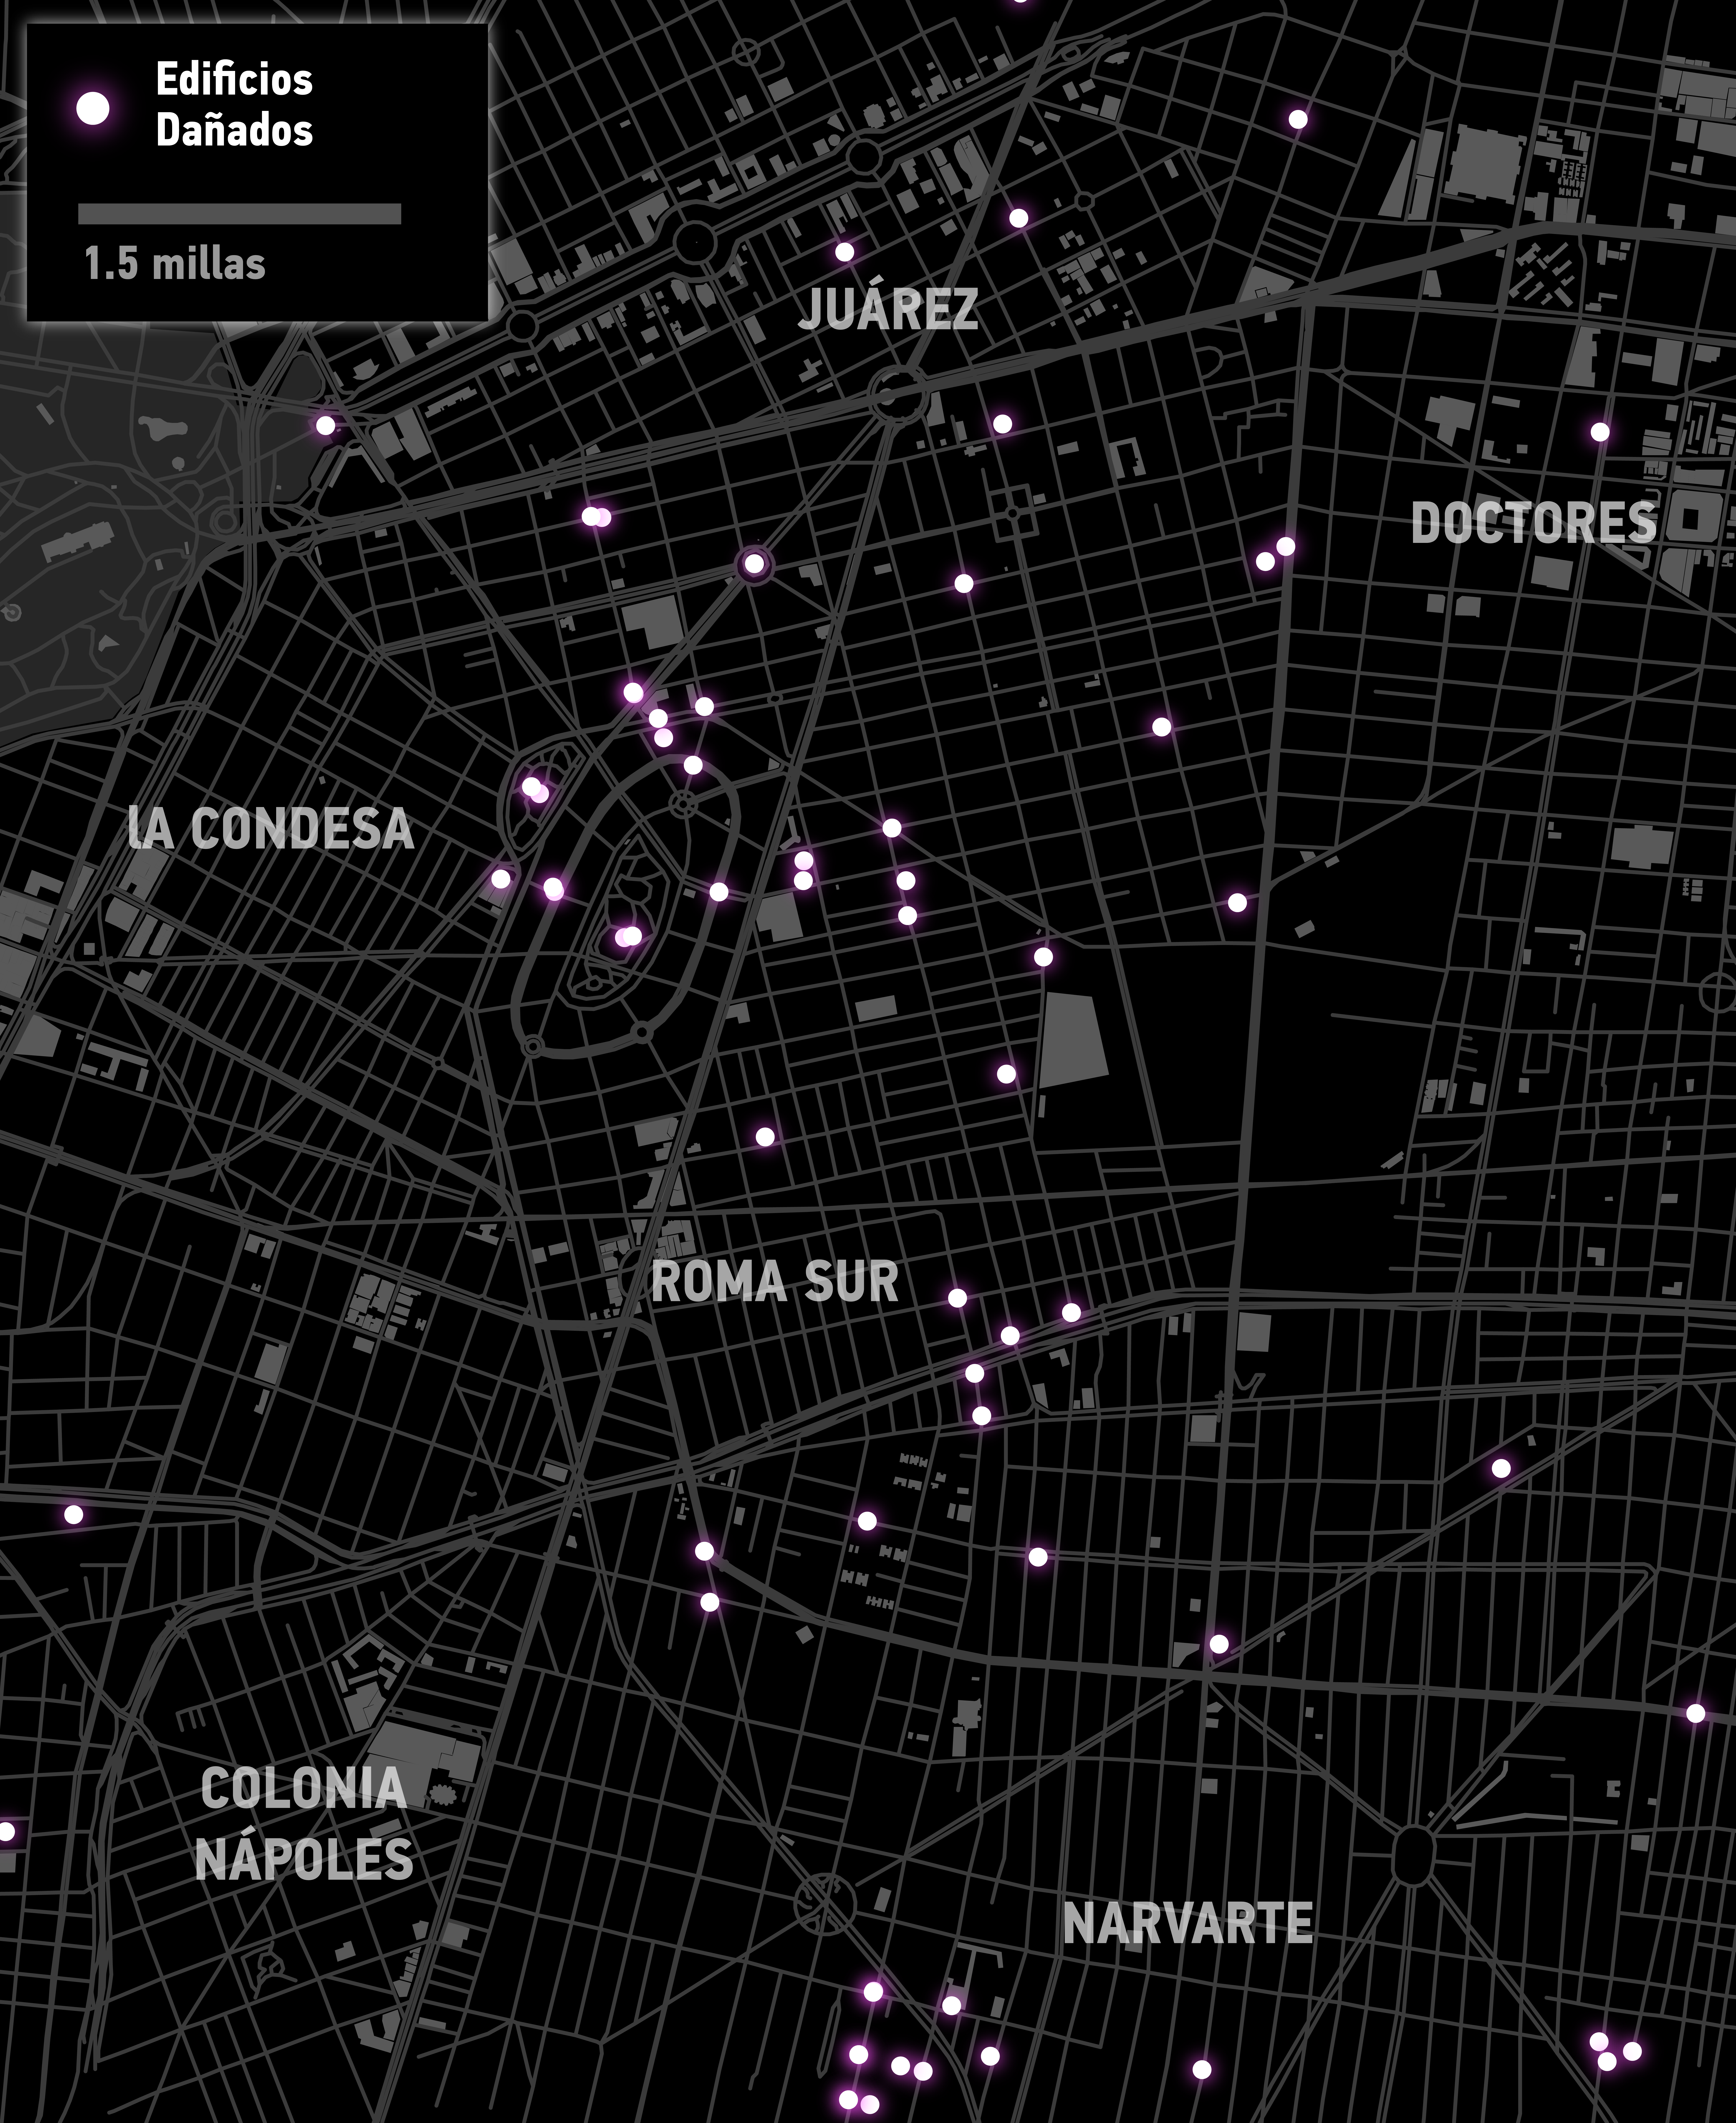
I'm currently interning at CityLab, a web publication that's part of The Atlantic. I've done many maps and other data visualization while working there. Many of these maps were done in several hours, from data accusition to final label placement, in order to publish the artciles while the topics are still fresh on everyone's mind. CityLab has around 200,000 subscribers.
The Geography of Mass Shootimgs
America's Most and Least Distressed Cities
The Poor in Hurricane Irma's Path
