Arctic Cartography
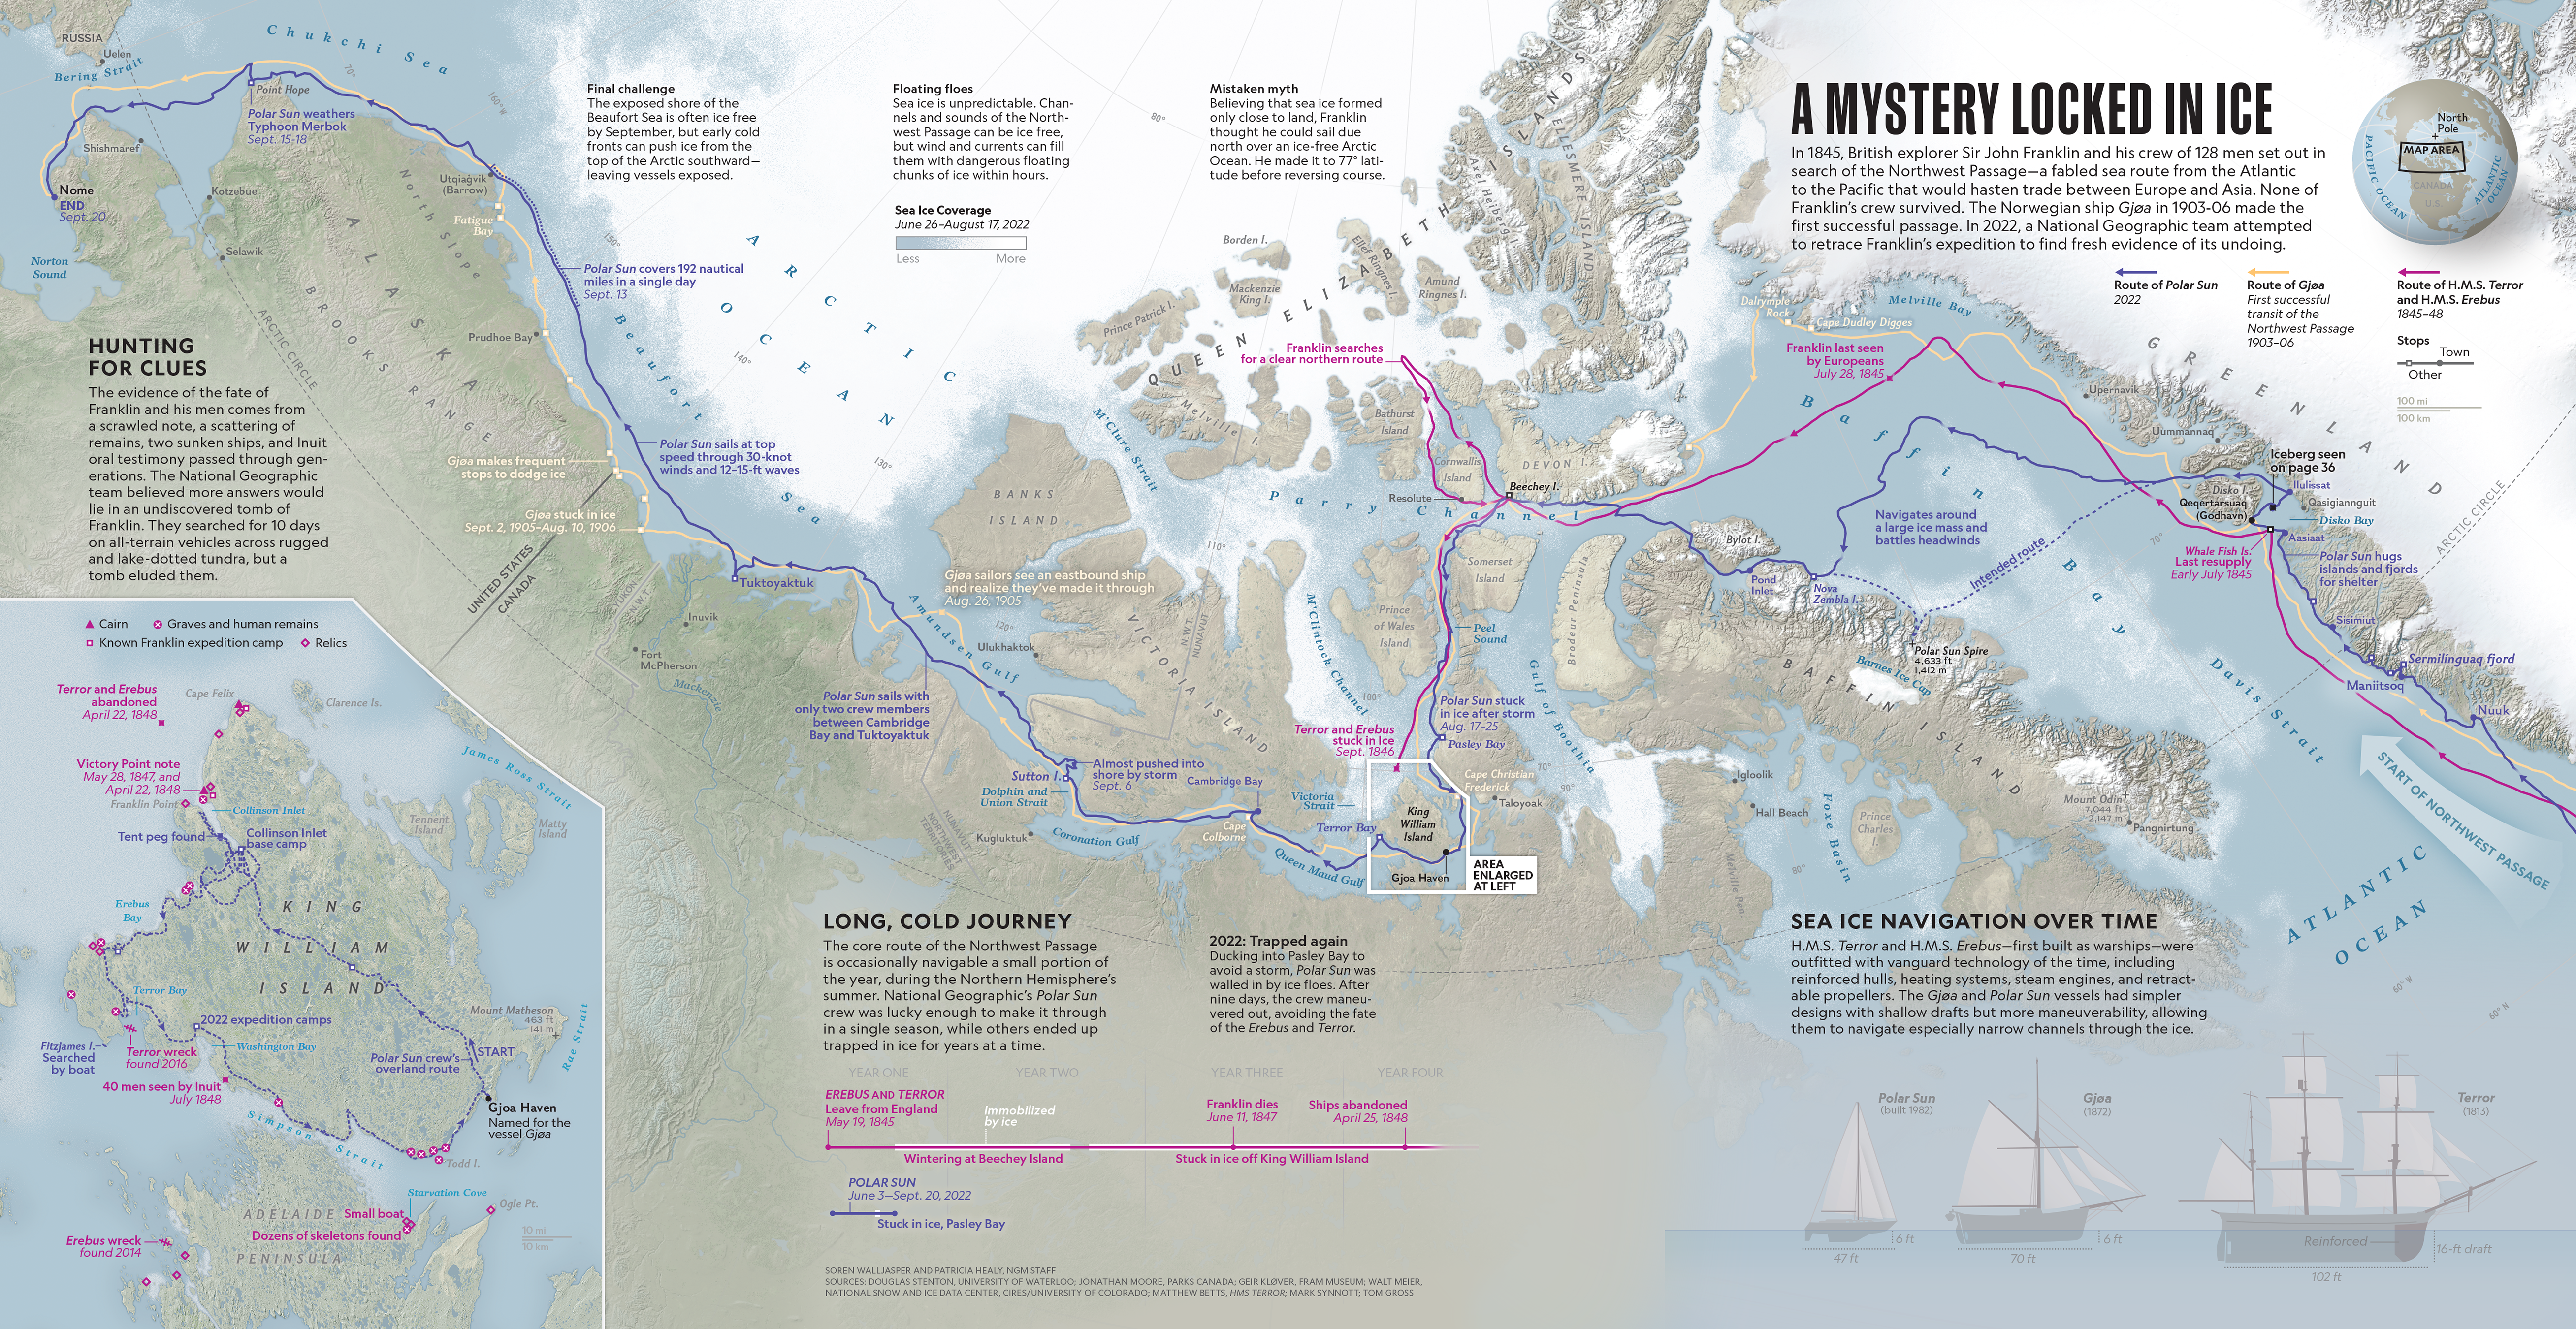
This map was an exciting challenge because I had to represent sea ice—an unpredictable, ever-changing feature. I worked closely with polar scientists, overlaying and blending a years worth of ice data. I’m proud that we made something with both rigorous scientific accuracy that evokes the feel of ice. I also drew the ships in the corner. This map appeared as a gatefold so it is quite large—click to see it enlarged. See the digital version here.